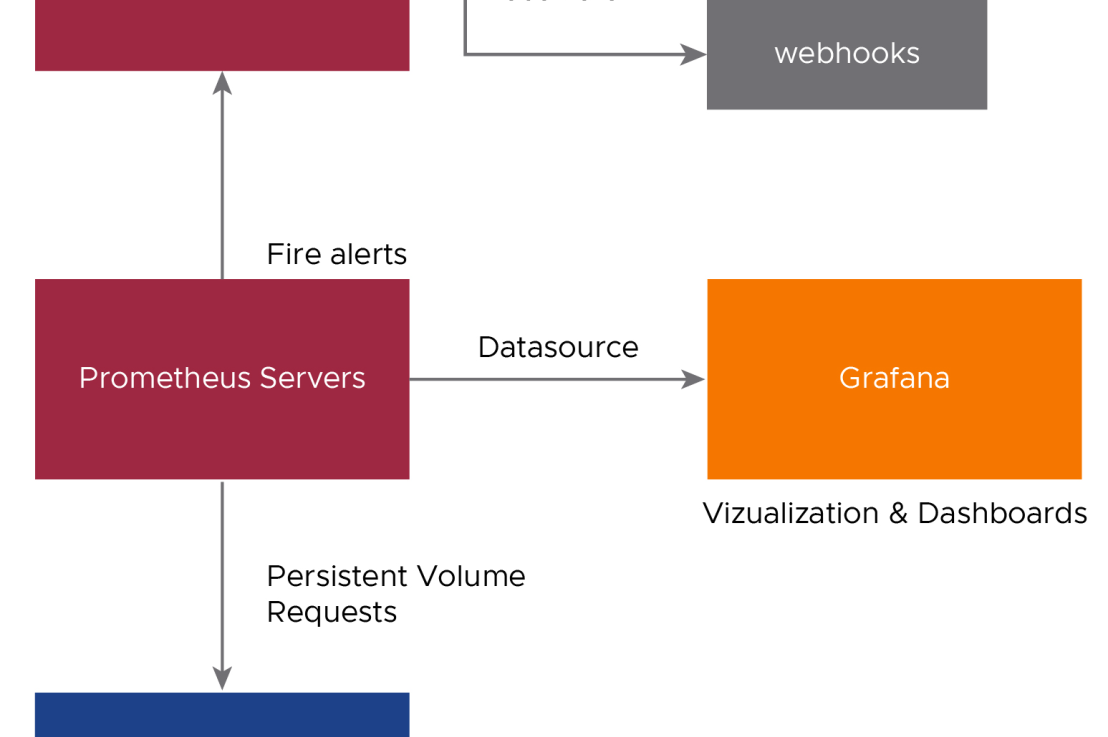
Prometheus is an open-source systems monitoring and alerting toolkit. It can collect metrics from target clusters at specified intervals, evaluate rule expressions, display the results, and trigger alerts if certain conditions arise.
Grafana is open-source visualization and analytics software. It allows you to query, visualize, alert, and explore your metrics no matter where they are stored. In other words, Grafana provides you with tools to turn your time-series database (TSDB) data into high-quality graphs and visualizations.

Deploy Prometheus on Workload Clusters
Prerequisites
- A bootstrap machine with the following installed:
- Tanzu CLI, Tanzu CLI plugins, and kubectl
- Carvel tools
- yq v4.5 or later.
- A workload cluster created by the management cluster above, with the following packages installed:
- Contour
- cert-manager
Deploy Prometheus into the Workload Cluster:
- Set the context of kubectl to the cluster. For example:
kubectl config use-context my-cluster-admin@my-cluster
2. Confirm that the Prometheus package is available in your workload cluster:
tanzu package available list -A
3. Retrieve the version of the available package:
tanzu package available list prometheus.tanzu.vmware.com -A
4. Create a configuration file. This file configures the Prometheus package.
tanzu package available get prometheus.tanzu.vmware.com/2.37.0+vmware.3-tkg.1 --default-values-file-output prometheus-data-values.yaml
After you make any changes needed to your prometheus-data-values.yaml file, remove all comments in it:
5. Deploy Prometheus with Default Configurations
tanzu package install prometheus --package prometheus.tanzu.vmware.com --version 2.37.0+vmware.3-tkg.1 --namespace my-packages --values-file prometheus-data-values.yaml
Deploy Prometheus with Custom Values:
ingress:
enabled: true
virtual_host_fqdn: “prometheus.tanzu.lab”
prometheus_prefix: “/”
alertmanager_prefix: “/alertmanager/”
prometheusServicePort: 80
alertmanagerServicePort: 80
prometheus:
pvc:
storageClassName: STORAGE-CLASS
alertmanager:
pvc:
storageClassName: STORAGE-CLASS
6. Confirm that the Prometheus package is installed.
tanzu package installed list -A
7. Confirm that the Prometheus app is successfully reconciled:
kubectl get apps -A
8. Confirm that the new services are running by listing all of the pods:
kubectl get pods -n tanzu-system-monitoring
9. Update a Running Prometheus Deployment if needed.
Update the Prometheus configuration in the prometheus-data-values.yaml file.
Update the installed package:tanzu package installed update prometheus \
--version 2.27.0+vmware.1-tkg.1 \
--values-file prometheus-data-values.yaml \
--namespace my-packages
10. Delete a Prometheus Deployment if needed.
To remove the Prometheus package on your cluster, run:
tanzu package installed delete prometheus --namespace my-packages
Deploy Grafana on Workload Clusters
Prerequisites
- A bootstrap machine with the following installed:
- Tanzu CLI, Tanzu CLI plugins, and kubectl
- Carvel tools
- yq v4.5 or later.
- A management cluster, either a vSphere with Tanzu Supervisor or a standalone management cluster running on vSphere, AWS, or Azure, with the Tanzu Standard package repository installed.
- A workload cluster was created by the management cluster above, with the following packages installed:
- Prometheus
- Contour
- cert-manager
Deploy Grafana into the Workload Cluster
- Set the context of kubectl to the cluster. For example:
kubectl config use-context my-cluster-admin@my-cluster
2. Confirm that the Grafana package is available in your workload cluster:
tanzu package available list -A
3. Retrieve the version of the available package:
tanzu package available list grafana.tanzu.vmware.com -A
4. Create a configuration file for your Grafana configuration:
tanzu package available get grafana.tanzu.vmware.com/7.5.17+vmware.2-tkg.1 --default-values-file-output grafana-data-values.yaml
grafana:
deployment:
replicas: 1
updateStrategy: Recreate
pvc:
accessMode: ReadWriteOnce
storage: 2Gi
storageClassName: vsphere-sc
service:
port: 80
targetPort: 3000
type: ClusterIP
ingress:
enabled: true
prefix: /
servicePort: 80
virtual_host_fqdn: grafana.tanzu.lab
5. Deploy the package:
tanzu package install grafana --package grafana.tanzu.vmware.com --version 7.5.17+vmware.2-tkg.1 --values-file grafana-data-values.yaml --namespace my-packages
6. Verify Grafana Deployment
Confirm that the Grafana package is installed. For example:
tanzu package installed list -A
Confirm that the grafana app is successfully reconciled:
kubectl get apps -A
Confirm that the new services are running by listing all of the pods that are running in the cluster:
kubectl get pods -n grafana
7. Delete a Grafana Deployment, If needed.
To remove the Grafana package on your cluster, run:
tanzu package installed delete grafana --namespace my-packages
Access the Grafana Dashboard
After Grafana is deployed, the grafana package creates a Contour HTTPProxy object with a Fully Qualified Domain Name (FQDN) of grafana.system.tanzu.
To use this FQDN to access the Grafana dashboard:
- Create an entry in your local /etc/hosts file that points an IP address to this FQDN:
- AWS or Azure: Use the IP address of the LoadBalancer for the Envoy service in the tanzu-system-ingress namespace.
- vSphere: Use the IP address of a worker node.
- Navigate to https://grafana.system.tanzu.
Because the site uses self-signed certificates, you might need to navigate through a browser-specific security warning before you are able to access the dashboard.
